

Solana slips to $68.68 as ETF inflows give way to withdrawals
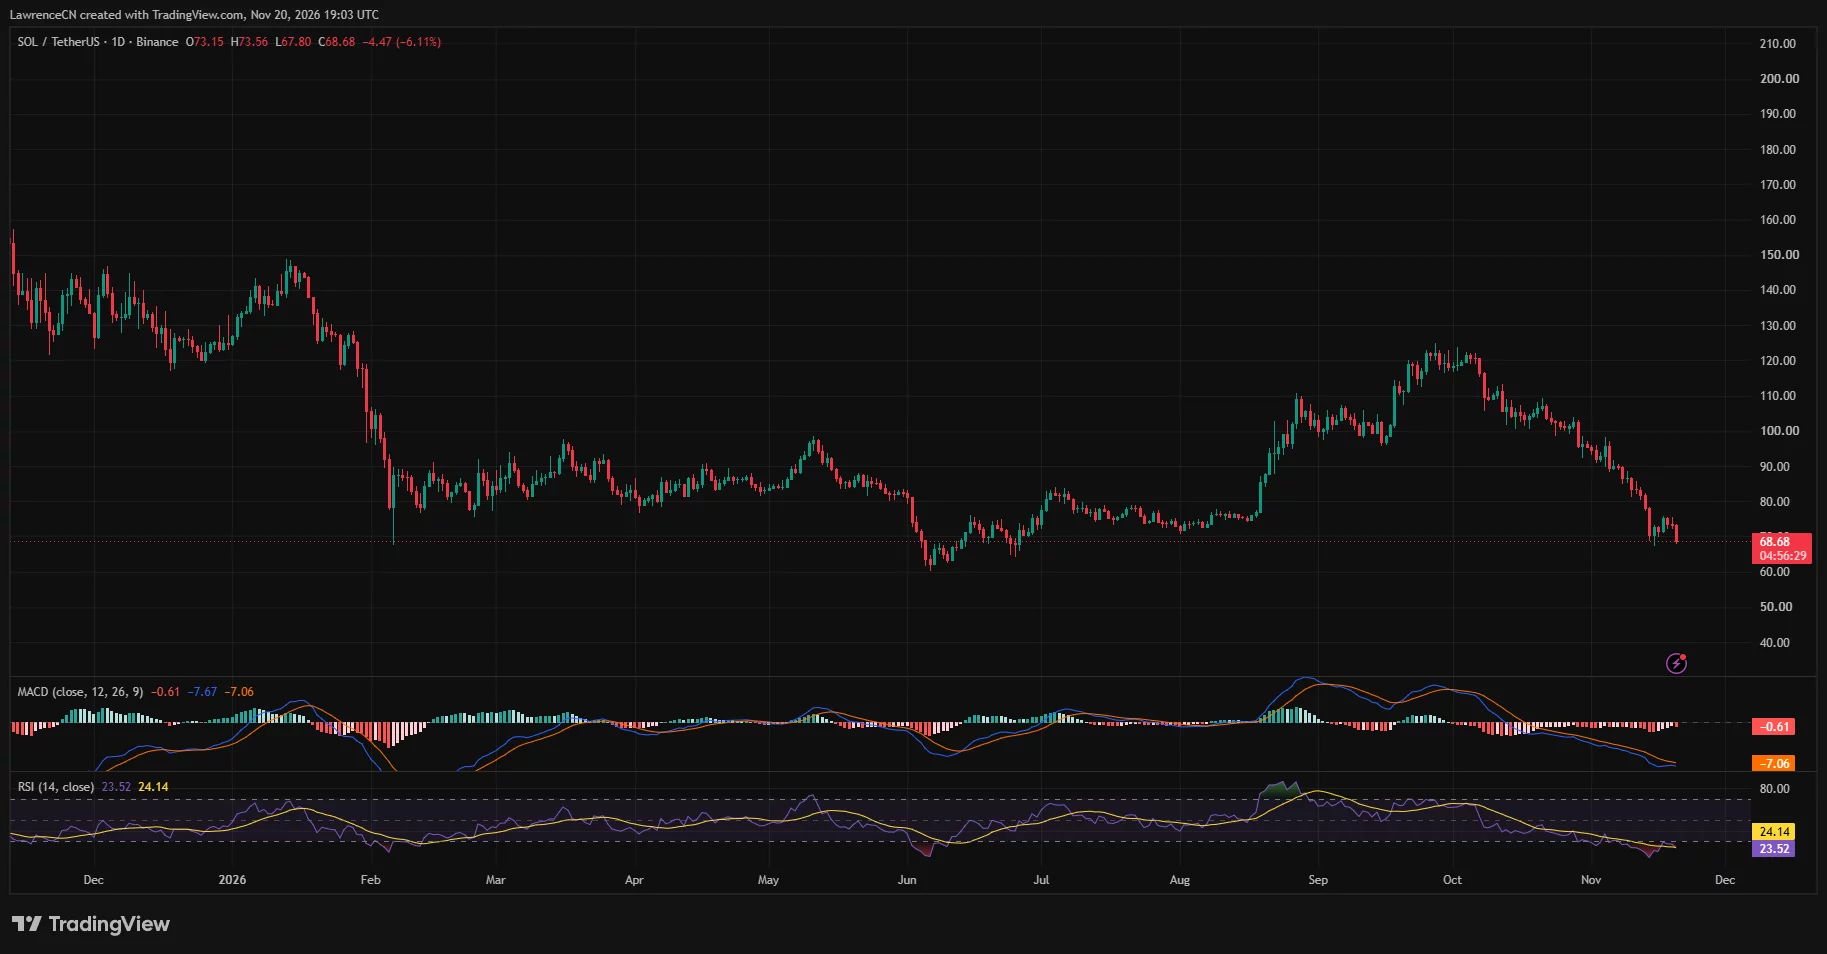
Solana has fallen 6.1% to $68.68 on Nov. 20, giving up most of its rebound from a four-month low even after U.S. spot Solana funds took in nearly $12 million earlier in the week.
Summary
- SOL fell as low as $67.80 on Binance, close to its November low of $67.41.
- Bitwise accounted for $10.8 million of the $11.7 million that flowed into U.S. spot Solana ETFs on Nov. 16.
- Solana’s daily RSI fell to 23.52 as the price slipped below the $72 level Trader Symba had been watching.
- CoinGlass showed a cluster of estimated liquidation levels near $76–$77, just above the week’s high.
TradingView’s Binance SOL/USDT chart showed Solana at $68.68 at press time, down from a session high of $73.56. The latest reading put SOL roughly 36% below its Oct. 21 close of $106.93. The token lost $100 in late October and fell below $90 in early November before touching $67.41 on Nov. 15, its lowest in four months.
The slide came as other cryptocurrencies traded lower. crypto.news reported that Bitcoin hit $61,546 earlier on Nov. 20, down 10.8% over the preceding week, after U.S. technology stocks reversed their early gains following Anthropic’s Nasdaq debut. U.S. spot Bitcoin ETFs had recorded $582.3 million in net withdrawals in the previous session.
Solana ETF buying fades after Monday’s inflow
Farside Investors recorded $11.7 million in net inflows to U.S. spot Solana ETFs on Nov. 16, with $10.8 million going to Bitwise’s BSOL and $900,000 to VanEck’s VSOL. The next two sessions showed zero net flows, and Grayscale’s GSOL posted a $1.1 million outflow on Nov. 19.
The inflow followed six consecutive weeks of net withdrawals through Nov. 13. The funds lost about $197.4 million over that period, including roughly $32 million in the final week. Across the four sessions from Nov. 16 through Nov. 19, Farside’s figures still showed a net inflow of $10.6 million. Over the same stretch, the rebound in SOL stalled below $76 before Friday’s return to the upper $60s.
Solana loses the $72 level traders were watching
On X, Trader Symba noted he spotted a possible ascending triangle on Solana’s two-hour chart earlier on Nov. 20. The setup had a rising line through successive lows near $72, while rallies had repeatedly stalled around $75–$76.
“A confirmed breakout above this resistance could trigger a stronger rally towards $78–$80,” Symba wrote.
By the time of the later Binance snapshot, SOL had slipped below the rising support area. Its session low of $67.80 came within 39 cents of the Nov. 15 trough, putting the two lows in the same $67–$68 area. On the upside, $70–$72 is the first area SOL would have to reclaim before it could revisit the resistance Symba identified.
The daily relative strength index fell to 23.52, below the conventional oversold threshold of 30. The daily MACD line was at minus 7.67, below its signal line at minus 7.06. Both lines remained below zero, and the histogram was negative as the price returned to the vicinity of the previous weekend’s low.
Weekly Bollinger Band sits near $59
On the weekly chart, SOL was down 5.57% at $68.72 with the candle still open. It had reached $75.78 earlier in the week, inside the resistance zone that Symba had identified on the two-hour chart.
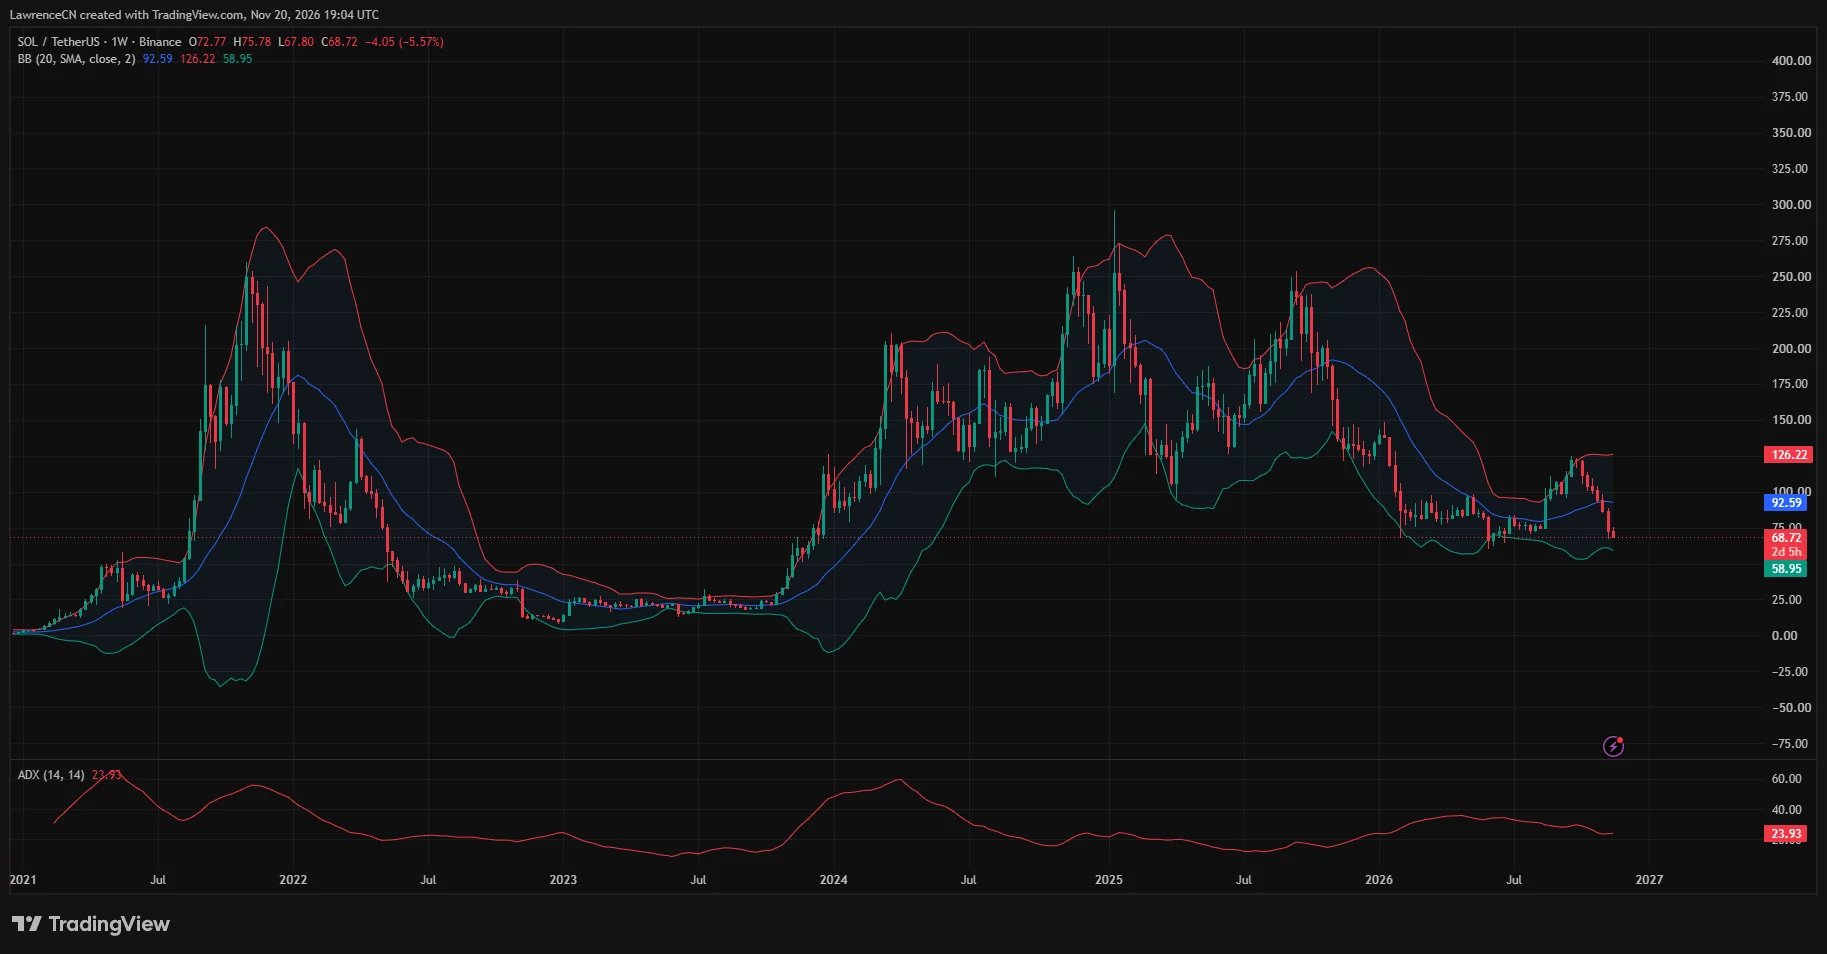
The weekly Bollinger Bands put the 20-week moving average at $92.59 and the lower band at $58.95. The daily chart showed a previous swing low in the low $60s in June, between the November trough and that lower weekly band.
Weekly ADX stood at 23.93, just below the commonly watched 25 level. ADX measures trend strength, while the price chart shows direction. The weekly candle had opened at $72.77 and traded in a range of nearly $8 by the time of the snapshot.
Liquidation heatmap shows a brighter band near $77
CoinGlass’s one-month heatmap put SOL at $68.63, close to the readings on both TradingView charts. The nearest bands of estimated liquidation levels above the price sat around $69–$72. A more concentrated band appeared near $76–$77, just above the week’s high.
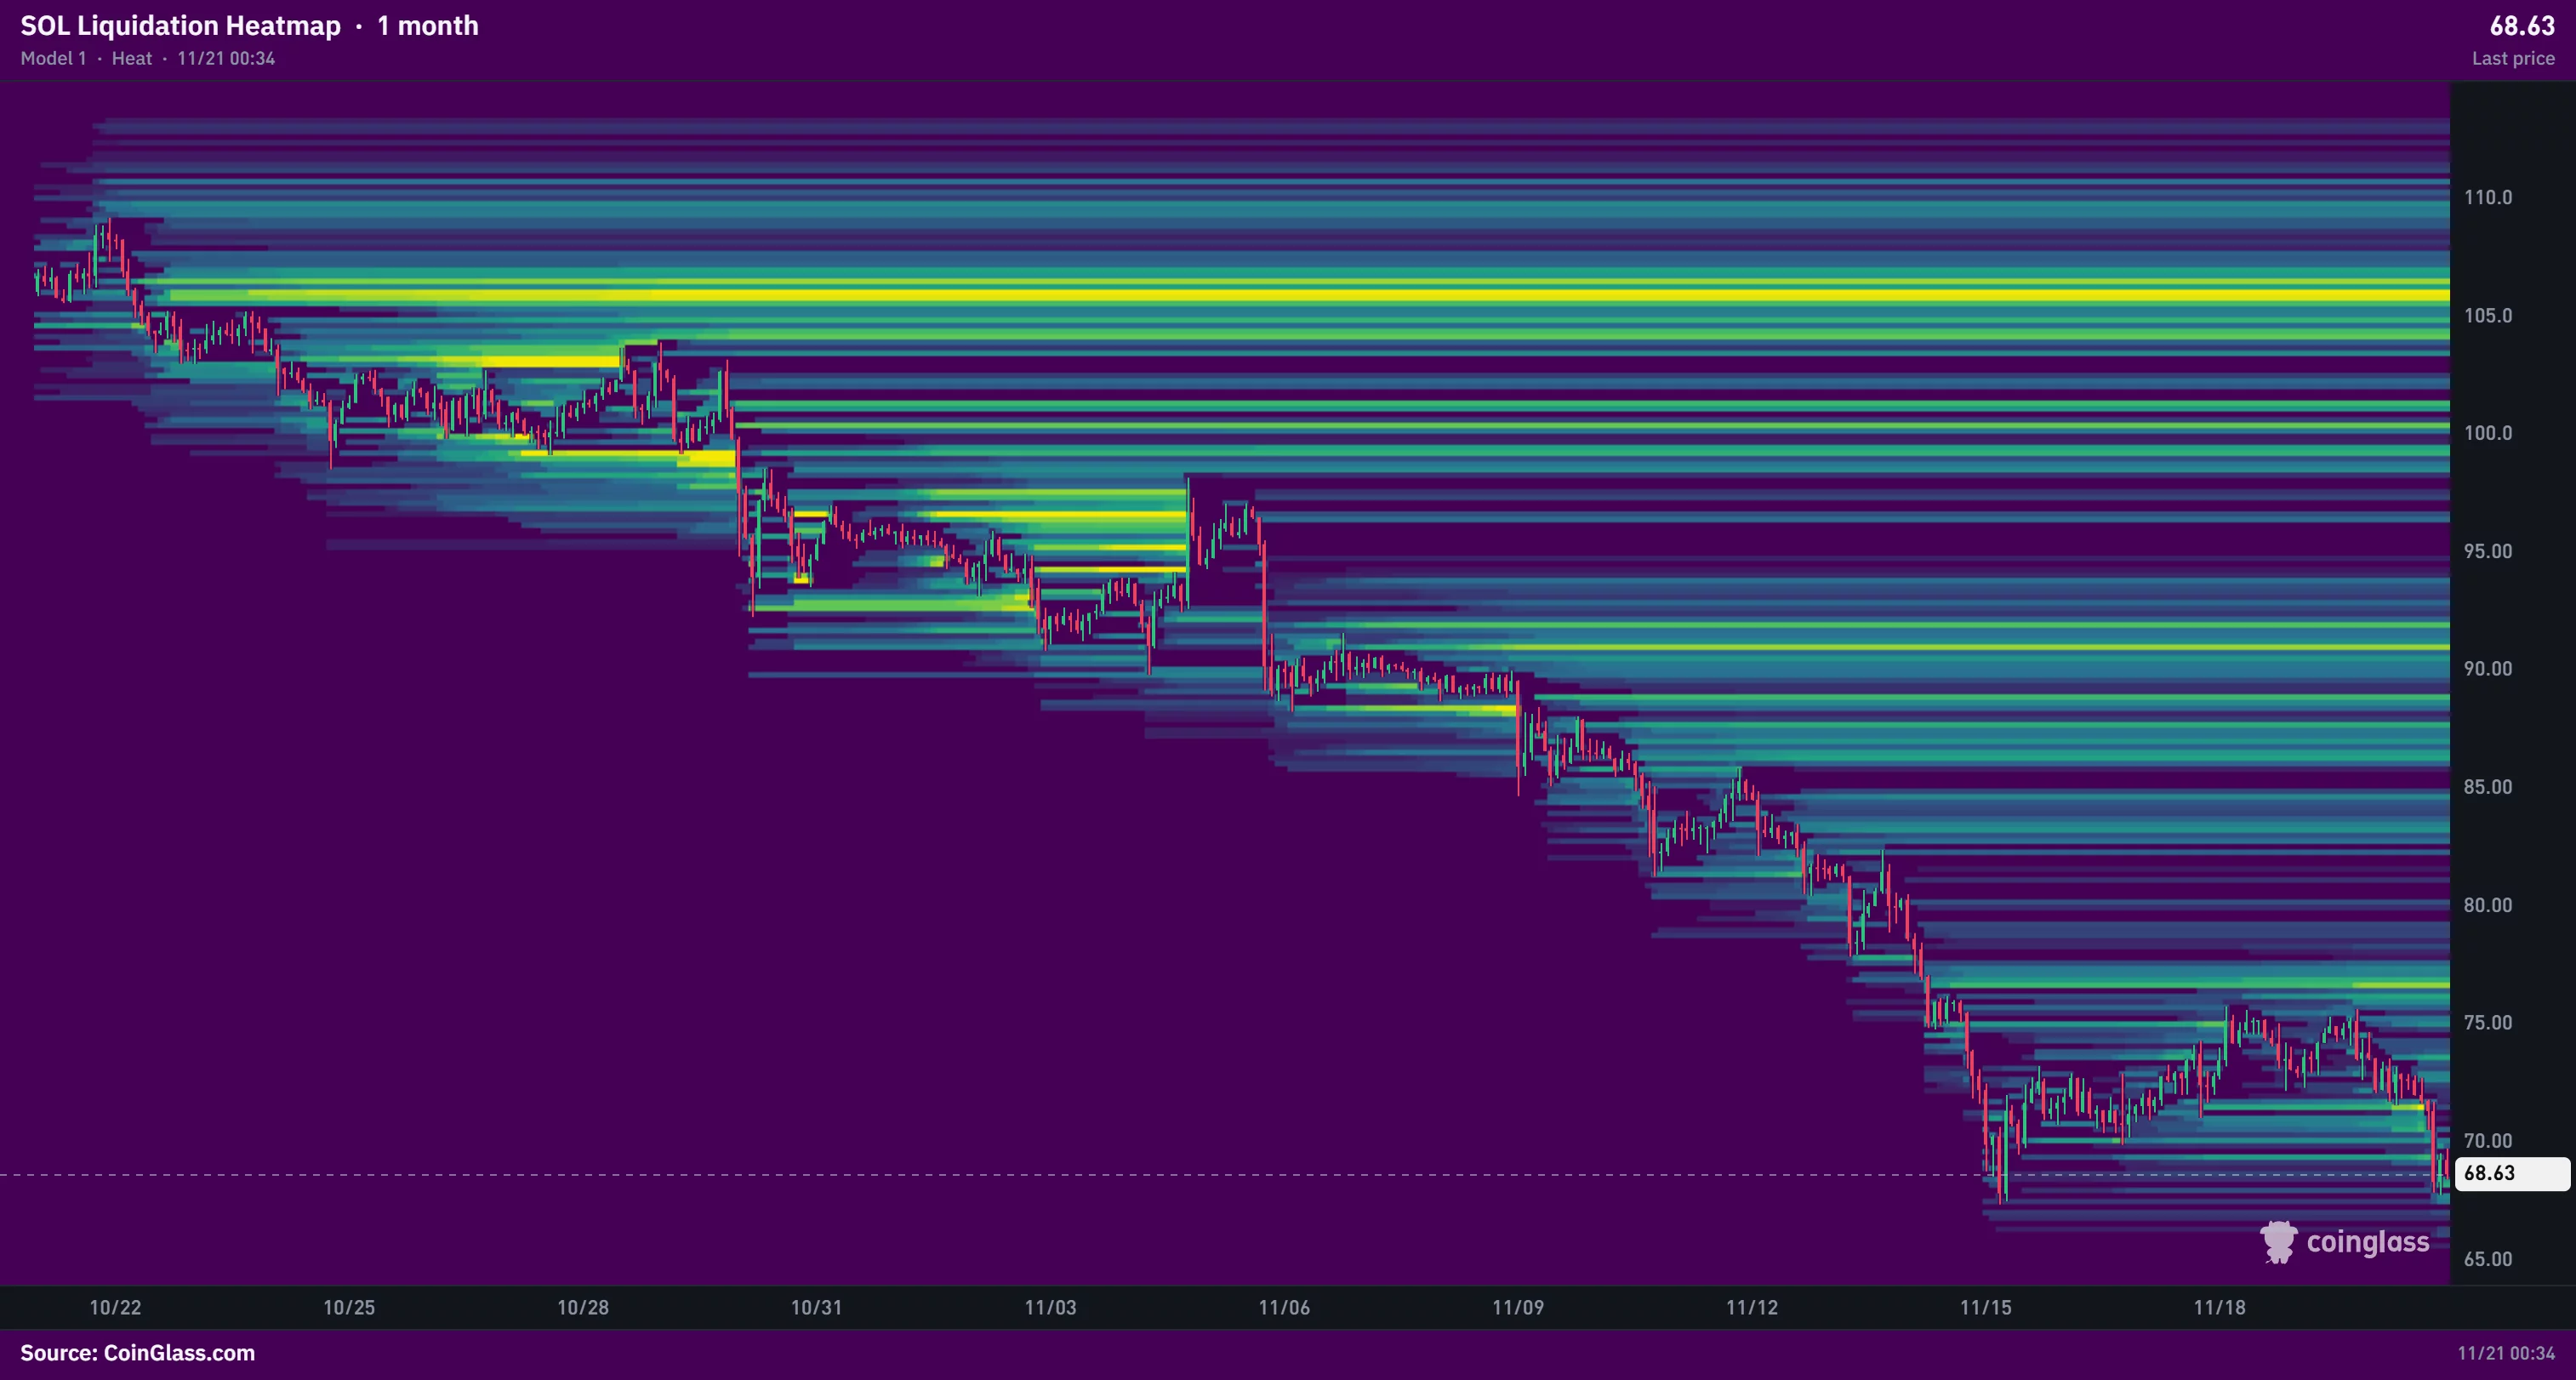
Below the latest price, the heatmap showed thinner bands in the upper $60s. Farther up, more pronounced bands were visible around $91 and $100–$101. The brightest band on the one-month chart ran near $106 and had persisted since late October.
Disclosure: This article does not represent investment advice. The content and materials featured on this page are for educational purposes only.