
Where Is ETH Headed After the $1,950 Rejection?
Ethereum remains under pressure on the higher timeframes despite showing signs of stabilization over the past several weeks. The daily structure continues to trade below key moving averages, while the 4-hour chart shows buyers attempting to build a higher low above a key support area. On-chain data also continues to provide a constructive backdrop as exchange balances keep declining.
Ethereum Price Analysis: The Daily Chart
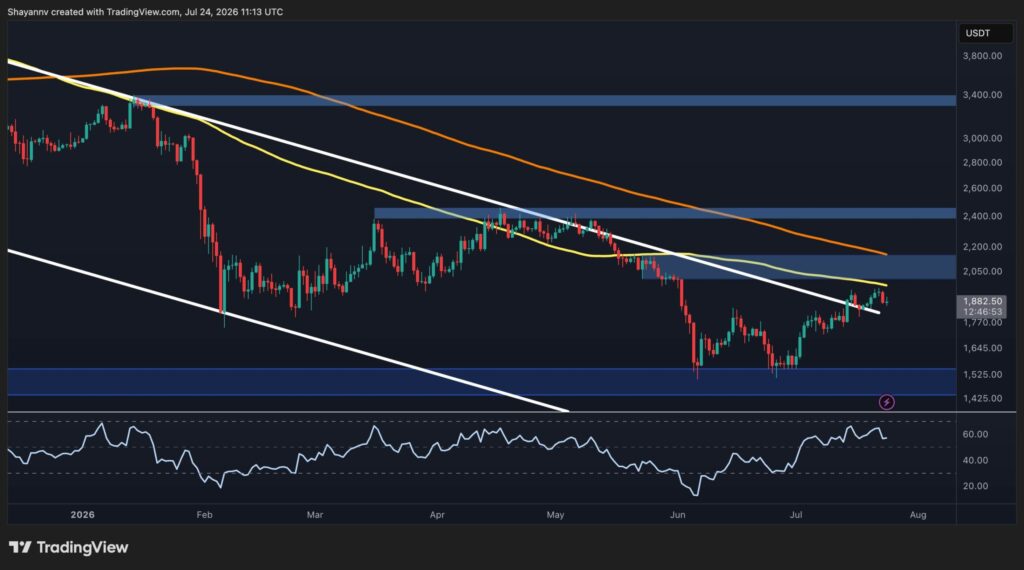
The daily chart shows ETH trading around $1.86K after recovering from the June sell-off that briefly pushed the price into the major demand zone around $1.5K. Although that support area successfully halted the decline, the broader trend has yet to shift decisively in favor of the bulls.
The asset sits just above the higher trendline of the long-term descending channel after the recent breakout. However, both the 100-day and 200-day moving averages are still overhead, indicating that sellers still control the higher timeframe structure. The recent test of the 100-day moving average around $2k has been rejected, which leaves ETH trapped beneath several technical barriers.
The first resistance sits around the $2K supply zone, where the key moving averages also converge. A stronger resistance zone is located roughly around $2.4K, which capped the previous recovery attempt in April. Reclaiming these levels would be required to suggest that the broader downtrend is losing momentum.
ETH/USDT 4-Hour Chart
The lower timeframe presents a more constructive picture. Since the early July rebound, ETH has been printing higher highs and higher lows while respecting a rising trendline (white) that continues to support the advance.
Yet, following the rejection from the higher boundary of the ascending channel (yellow), the asset has pulled back toward the white trendline, where buyers have so far stepped in. These trendlines form a short-term rising wedge, and as long as price remains above the lower bound and the $1.75K support zone, the short-term bullish structure remains intact.
The next objective for buyers is another test of the recent highs around $1.9K to $1.95K. A decisive breakout above that region and the channel could open the path toward the daily supply zone at $2K.
On the other hand, a breakdown below the white ascending trendline would weaken the short-term structure and increase the probability of a deeper retracement toward $1.75K, with $1.7K and $1.6k serving as the next notable support levels.

On-Chain Analysis
The Exchange Supply Ratio continues to trend lower, reaching fresh lows despite Ethereum’s prolonged corrective phase. This metric measures the proportion of ETH held on centralized exchanges, and a declining reading generally indicates that coins are leaving exchanges and moving into private wallets or long-term storage.
The persistent decline suggests that sell-side liquidity available on exchanges continues to shrink. Historically, sustained exchange outflows have often reflected improving investor conviction and reduced immediate selling pressure.
Although this alone does not guarantee an upside reversal, the on-chain backdrop appears considerably healthier than the current price structure. If demand begins to strengthen while exchange balances remain depressed, the reduced available supply could provide additional support for a broader recovery once ETH overcomes its key technical resistance levels.

LIMITED OFFER for CryptoPotato readers at Bybit: Use this link to register and open a $500 FREE position on any coin!
Disclaimer: Information found on CryptoPotato is those of writers quoted. It does not represent the opinions of CryptoPotato on whether to buy, sell, or hold any investments. You are advised to conduct your own research before making any investment decisions. Use provided information at your own risk. See Disclaimer for more information.