

Hyperliquid price forms bearish double top, will it crash back to $35?
Hyperliquid price extended its decline on Tuesday after failing to hold above a key resistance zone, raising concerns that a bearish double top pattern may now be forming on the daily chart.
Summary
- Hyperliquid price fell toward $39 after forming a potential bearish double top pattern near the $44–$45 resistance zone.
- Whale positioning on Hyperliquid reached $4.236 billion, with long and short exposure remaining nearly balanced at a 0.98 ratio.
- A bearish MACD crossover and weakening momentum indicators raised the risk of a deeper correction toward the key $35 support level.
According to data from crypto.news, Hyperliquid (HYPE) price dropped to around $39.2 at press time on May 13 after briefly trading above $44 earlier this month. Despite the recent pullback, the token still remains significantly above its April lows near the $35 region.
The latest correction comes as whale positioning on Hyperliquid reached roughly $4.236 billion in total exposure, with large traders showing an unusually balanced stance between bullish and bearish bets. Long positions accounted for around $2.099 billion, while short positions stood slightly higher near $2.137 billion, producing a near-neutral long-short ratio of 0.98.
The positioning suggests that institutional and high-net-worth traders remain uncertain on the market’s near-term direction despite elevated volatility across digital assets.
At the same time, investor sentiment surrounding the Hyperliquid ecosystem has remained relatively strong following the launch of the first U.S.-listed exchange-traded funds tied to the HYPE token by 21Shares. The products include a spot ETF with staking exposure alongside a leveraged fund linked to the decentralized derivatives platform.
The ETF launch further strengthened Hyperliquid’s growing institutional profile as the protocol continues dominating decentralized perpetual futures trading. The platform currently controls a substantial share of decentralized perpetual open interest while processing billions of dollars in daily trading volume.
However, traders appear to have started locking in profits after HYPE repeatedly failed to break above the key $44–$45 resistance zone over the past several weeks.
Hyperliquid price analysis
On the daily chart, Hyperliquid price appears to have formed a bearish double top pattern with two major peaks established near the $44–$45 region. Typically, a double top pattern signals weakening bullish momentum and often precedes a deeper correction once the neckline support breaks.
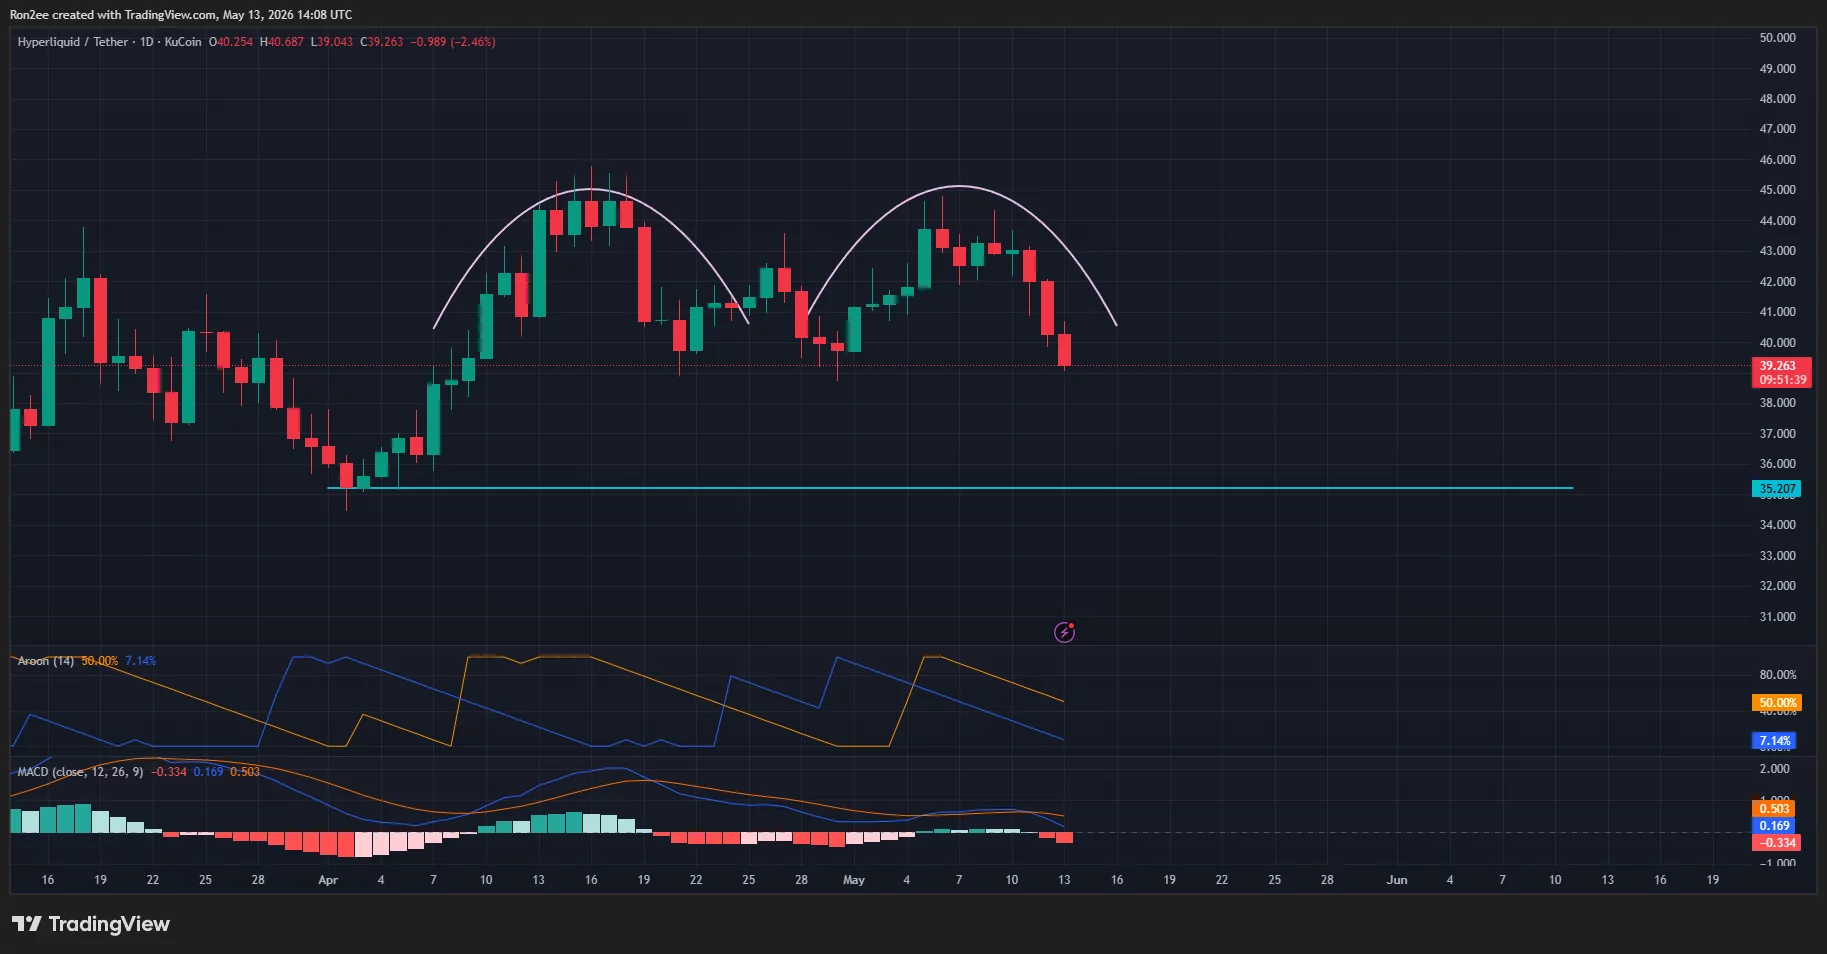
The neckline of the pattern currently sits near the $35.2 support zone, which also aligns with a major horizontal support area that buyers defended aggressively during the April consolidation phase.
A look at the MACD indicator reinforces the weakening momentum outlook. The MACD histogram has turned negative again, while the MACD line has crossed below the signal line, confirming a bearish crossover and suggesting that downside pressure may continue building in the short term.
Meanwhile, the Aroon indicator also points to fading bullish momentum. The Aroon Up indicator has declined toward the 50% level while the Aroon Down remains subdued near 7%, signaling that buyers are gradually losing control of the trend even though broader bearish dominance has not yet fully emerged.
If sellers manage to push HYPE below the neckline support near $35, the bearish double top setup could trigger a larger correction toward the $31–$32 region.
On the upside, bulls would likely need to reclaim the $44 resistance area to invalidate the bearish structure and restore momentum toward the psychological $50 level.
Disclosure: This article does not represent investment advice. The content and materials featured on this page are for educational purposes only.