
ETH Struggles Below $2.5K, Is a Deeper Pullback Coming?
Ethereum has entered a consolidation phase after a sharp recovery from the $1.5K area.
The cryptocurrency is now trading slightly below $2.5K, holding relatively firm despite repeated tests of the upper end of its recent range. Meanwhile, exchange reserves continue to decline, pointing to a potentially constructive supply-side backdrop.
Ethereum Price Analysis: The Daily Chart
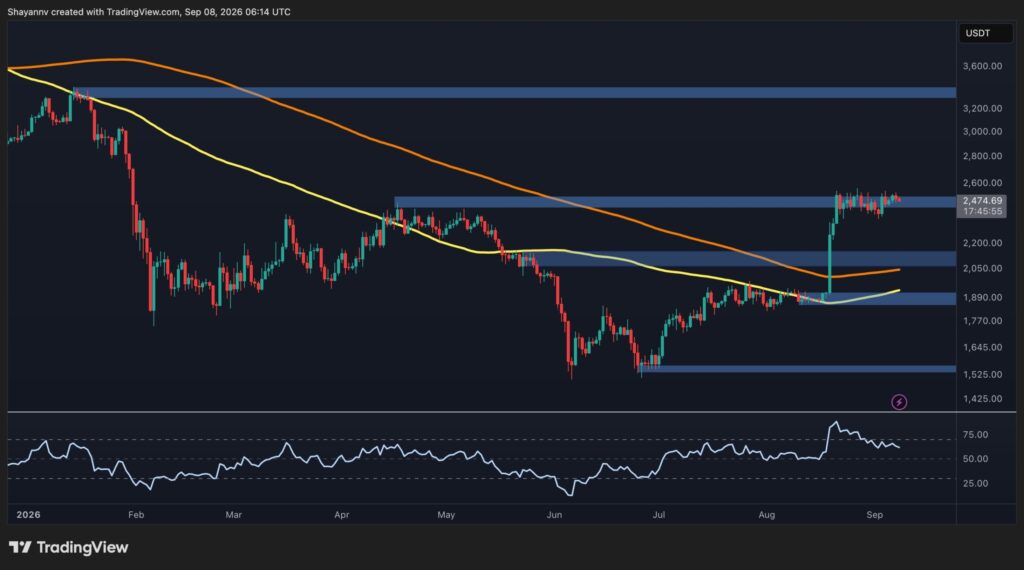
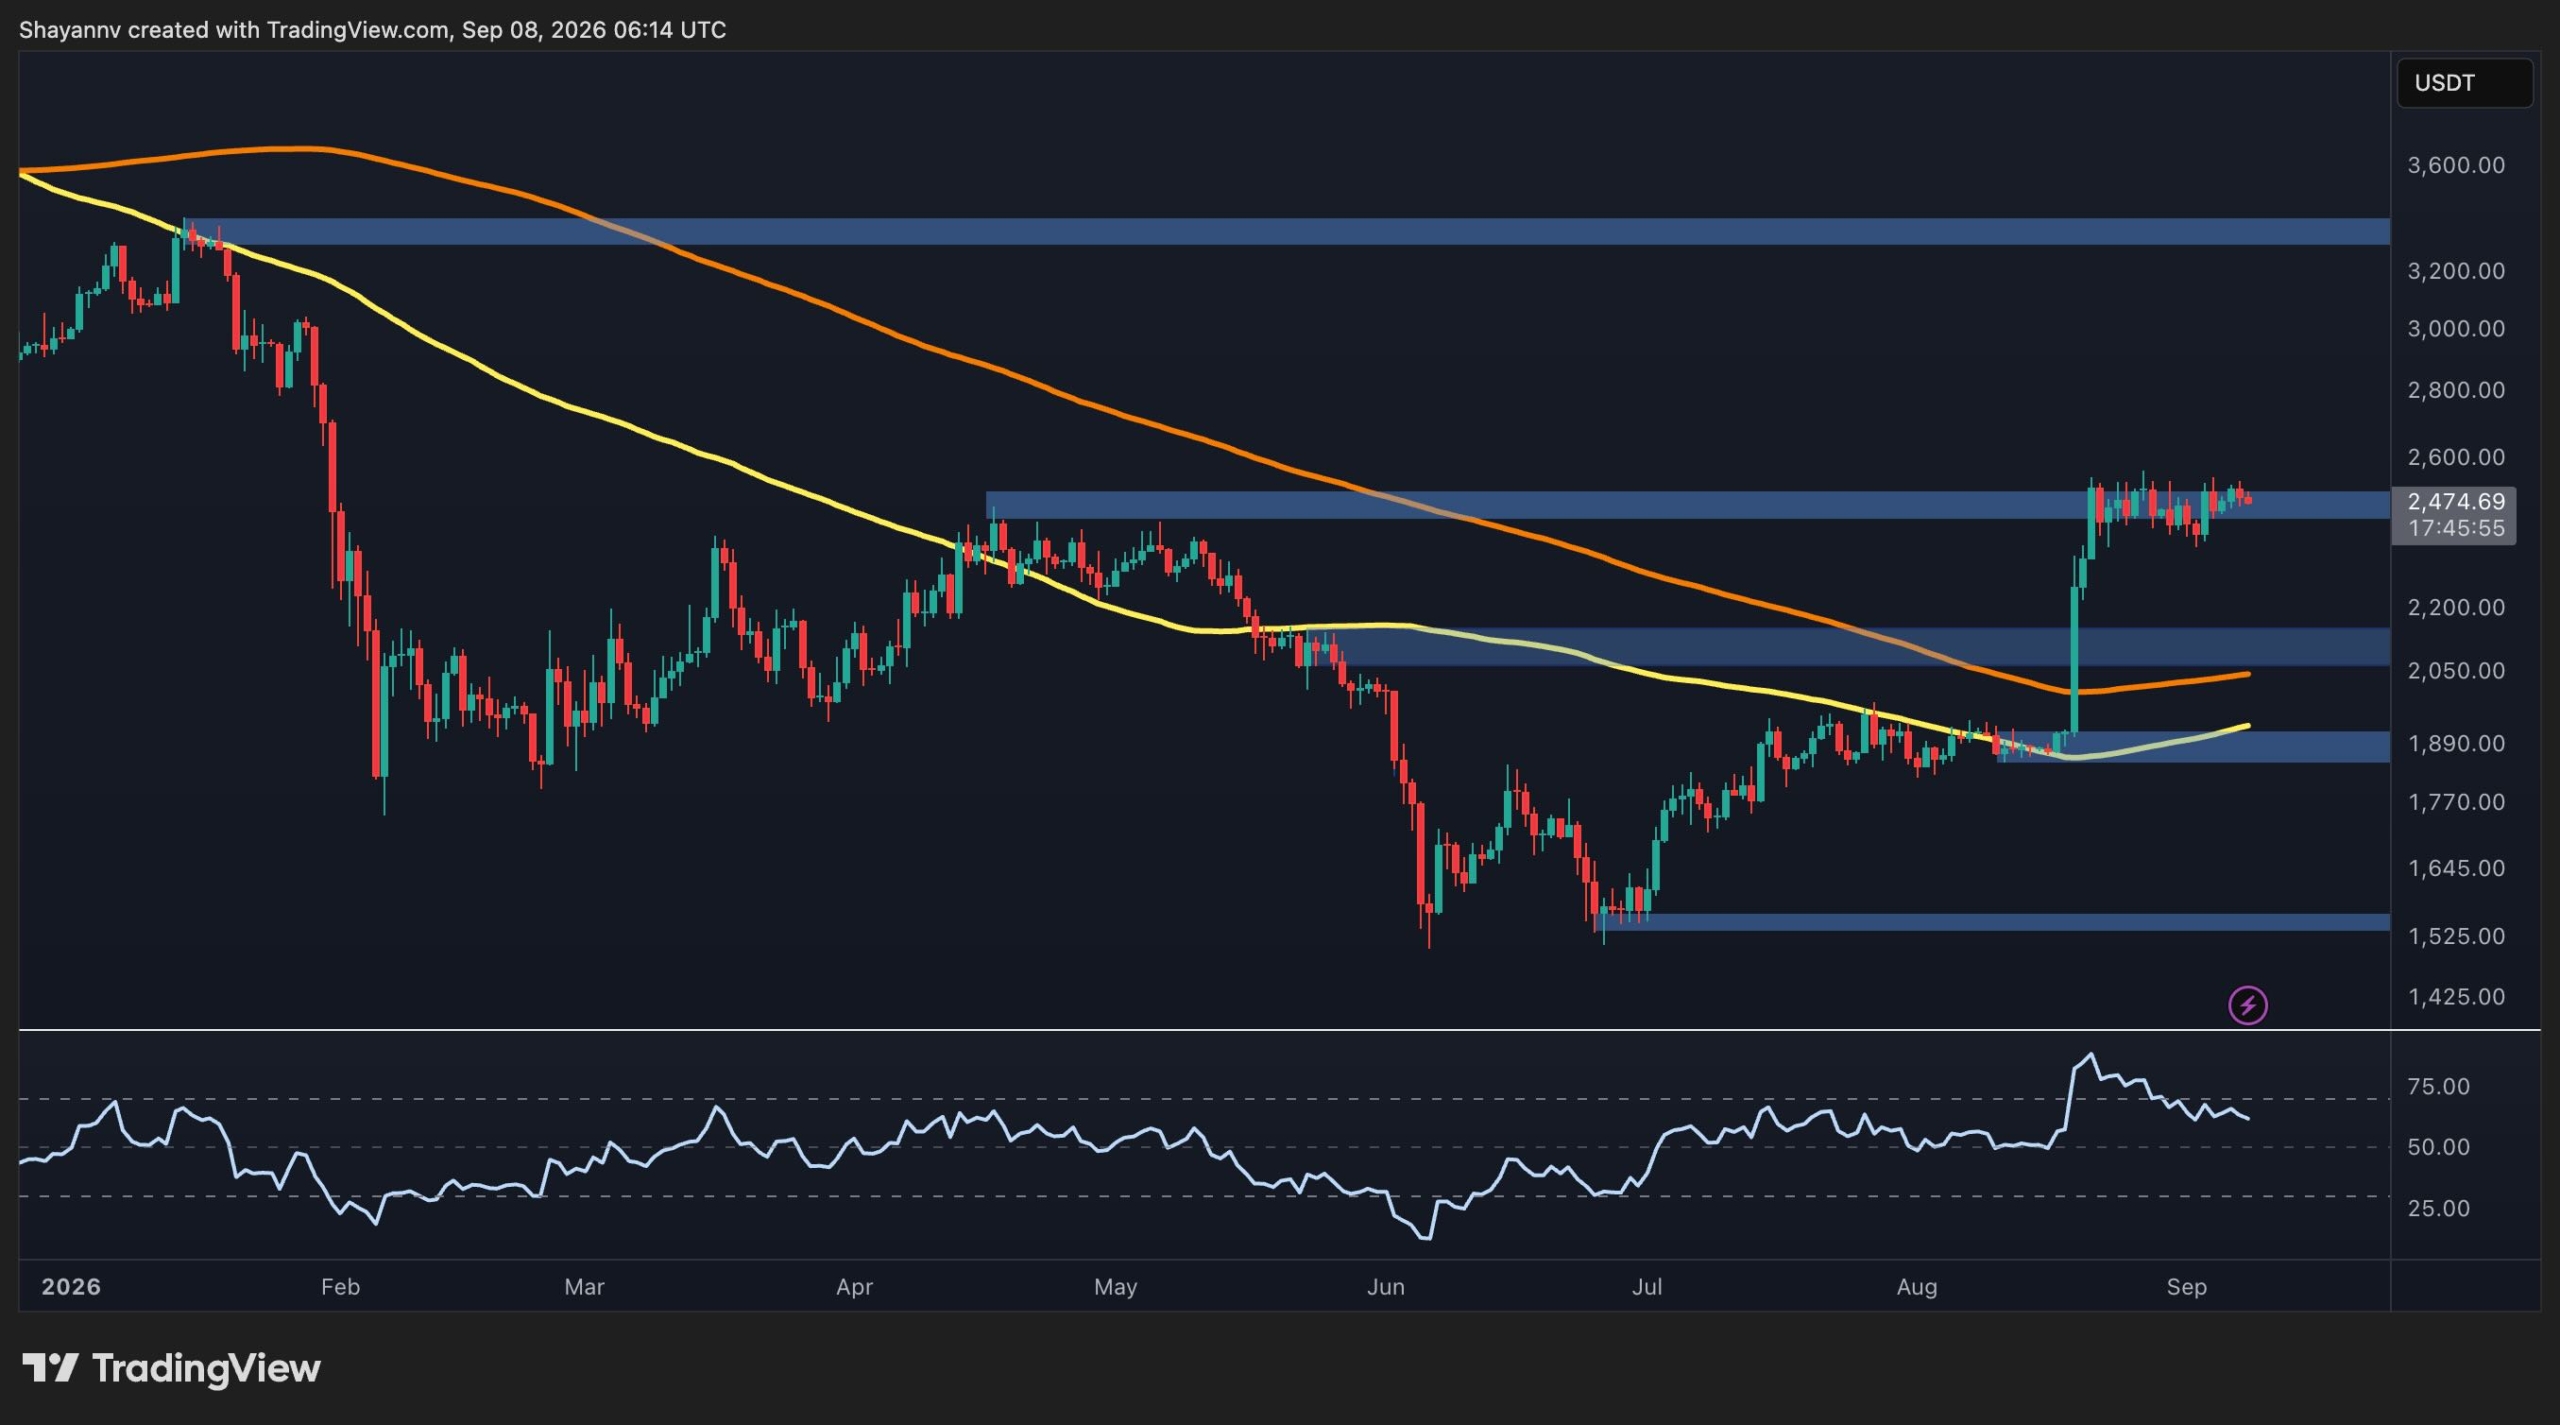
The daily structure has improved significantly over the past several weeks. ETH broke out of the prolonged base around the $1.9K zone and then reclaimed the $2.1K area, which had previously acted as major resistance.
The breakout was particularly strong, with ETH moving almost vertically from roughly $1.9K toward $2.5K. The price has since established itself above the moving averages shown on the chart, with both the 100-day and 200-day moving averages turning upward. This shows that the broader trend is transitioning from recovery toward a potentially bullish structure.
ETH is now trading inside a significant resistance zone around $2.4K-$2.5K, with the current price near $2.47K. The market has tested this area several times without a decisive daily breakout, making it the key level to watch. A sustained move above $2.5K could open the way toward the next resistance area, which sits around $3.3K.
On the downside, the first important support is the former breakout area around $2.1K. As long as ETH remains above this region, the recent structural improvement remains intact. The daily RSI is also noteworthy, as it has risen considerably from the deeply weak levels seen during the June bottom but has retreated below the traditional overbought threshold.
This points to a potential consolidation or correction until the market cools off and fresh buying pressure emerges.
ETH/USDT 4-Hour Chart
The 4-hour chart shows a much clearer consolidation structure. Following the explosive move from the $1.9K area, ETH has been moving sideways inside a roughly $2.35K-$2.55K range.
Repeated reactions from the upper end of this range suggest sellers remain active around $2.45K-$2.5K, while buyers have consistently defended the lower boundary near $2.35K-$2.4K. ETH is currently positioned toward the middle of the range, as indecisiveness is also evident in the 4-hour RSI, which is hovering around 50.
A confirmed breakout above $2.5K would strengthen the continuation setup and potentially expose higher resistance levels. Conversely, a break below $2.4K would suggest that the consolidation is turning into a deeper correction, with the $2.25K demand zone becoming the next major area of interest.

On-Chain Analysis
The exchange reserve chart provides an interesting backdrop to the technical picture. Ethereum’s exchange reserves have fallen steadily from above 21M ETH during 2025 to approximately 14.9M ETH currently, even as ETH has recovered toward $2.4K.
Exchange reserves measure the amount of ETH held on centralized exchanges. A persistent decline generally means fewer coins are immediately available on exchanges for potential selling, although the metric alone does not prove investors are accumulating.
The divergence is particularly notable in the latest portion of the chart. ETH has recovered sharply from its earlier lows while exchange reserves have continued trending downward. This suggests that the supply available on exchanges has not increased alongside the price recovery.
From a market-structure perspective, that can be supportive if demand continues to expand. With fewer ETH sitting on exchanges, a sustained increase in spot demand could potentially make it easier for price to move higher. However, treat the declining reserve trend as a supporting factor rather than a standalone bullish signal.

Disclaimer: Information found on CryptoPotato is those of writers quoted. It does not represent the opinions of CryptoPotato on whether to buy, sell, or hold any investments. You are advised to conduct your own research before making any investment decisions. Use provided information at your own risk. See Disclaimer for more information.