
BTC Stalls Near $80K Ahead of a Potential Volatility Storm
Bitcoin is trading near $79K after a sharp recovery from the $60K area, but the latest price action suggests that momentum is losing some steam beneath a major resistance zone. Meanwhile, adjusted SOPR has rebounded above 1, pointing to improving on-chain profitability, although the short-term price structure still requires a breakout for the recovery to extend.
Bitcoin Price Analysis: The Daily Chart
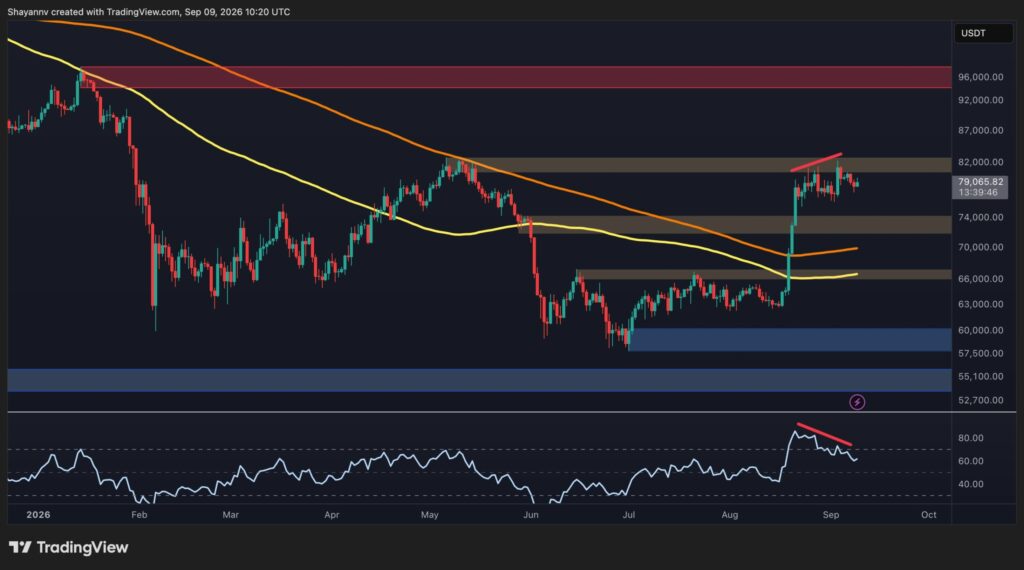
The daily chart shows that BTC has staged a significant recovery from the $60K demand area, eventually reclaiming the $67K region and pushing through the $72K-$74K zone. The asset is now consolidating around $79K, just below the $80K-$82K resistance area.
The mentioned resistance zone is the immediate obstacle. It has repeatedly capped the market since late August, while the yellow trendline connecting recent highs is also converging on this region. A decisive daily breakout above $82K would therefore represent an important structural development and could open the way toward the $96K resistance zone marked on the chart. On the downside, $72K-$74K is the first important support area.
Momentum is also showing some divergence. The RSI surged during the initial breakout but has since formed lower highs while the price remains close to its recent highs. This suggests that bullish momentum has cooled and raises the possibility of another consolidation or pullback before a sustained breakout attempt.
BTC/USDT 4-Hour Chart
Dropping onto the 4-hour chart, BTC has experienced a near-vertical move from roughly $64K to $80K before entering a sideways-to-slightly-rising structure. The price is currently oscillating between the lower boundary near $76K-$77K and the upper resistance around $80K-$82K. The yellow trendlines form a broad ascending structure, meaning the market is compressing while maintaining a sequence of higher lows and highs.
The latest rejection from the $82K area and subsequent retreat toward $79K indicate that sellers remain active near the upper boundary. At the same time, the asset has not broken the rising lower trendline, so the bullish structure remains technically intact.
A 4-hour candle closing above $82K would favor continuation toward the next major resistance above $90K. Conversely, a decisive break below the lower trendline of the pattern at $76K would weaken the current bullish setup and increase the probability of a retracement toward $72K-$74K.

On-Chain Analysis
The adjusted SOPR chart offers a constructive signal for Bitcoin’s recovery. Adjusted SOPR measures the profitability of spent coins while filtering out some of the noise created by short-term transfers. A reading above 1 generally indicates that coins being spent are, on aggregate, realizing profits, while readings below 1 indicate realized losses.
The metric has recently made a sharp recovery from deeply depressed levels and is now back above 1, with the latest reading around 1.01. This is notable because the improvement has occurred alongside BTC’s recovery toward $79K.
The chart also shows that aSOPR previously remained below 1 for an extended period during the first half of 2026, coinciding with Bitcoin’s weaker price performance. Its recent move back above the 1 threshold suggests that realized profitability has returned to the market and that the recovery is being accompanied by healthier spending behavior.
However, the metric is only slightly above 1 rather than displaying an extreme profitability spike. This could be viewed as a relatively constructive normalization rather than evidence of widespread profit-taking. If aSOPR can remain above 1 and trend higher while BTC breaks through $80K-$82K, the on-chain picture would strengthen the bullish continuation case, as the market would be relieved of panic-selling pressure and realizing losses.

Disclaimer: Information found on CryptoPotato is those of writers quoted. It does not represent the opinions of CryptoPotato on whether to buy, sell, or hold any investments. You are advised to conduct your own research before making any investment decisions. Use provided information at your own risk. See Disclaimer for more information.