
TOSHI and WLD rally amid Binance.US listing, how high can these tokens go?
Binance.US’s latest listings, Toshi and Worldcoin, sparked renewed interest in both tokens, but early price action suggests one is clearly leading the charge. How far can these rallies extend?
Summary
- Binance.US listed WLD on Aug. 6 and is set to list TOSHI on Aug. 7 at 7 a.m. EDT.
- TOSHI rallied over 20% after the listing announcement.
- WLD price action was muted amidst fresh concerns around regulatory backlash.
According to an Aug. 6 X post by Binance.US, the U.S. affiliate of crypto exchange Binance, it is set to list Toshi (TOSHI), a memecoin built on the Base network, on Aug. 7 at 7 a.m. EDT. Deposits for the token are already open.
TOSHI rose over 23% to an intraday high of $0.00069 before settling slightly lower at $0.00065 as of press time. The rally extended its gains over the past 7 days to 18% and nearly 200% from its year-to-date low.
The Binance.US listing adds another catalyst to TOSHI’s recent momentum. Earlier this month, Toshi also appeared on Binance Alpha, a curated platform within the Binance ecosystem that features promising early-stage tokens.
With listings now secured on both Binance Alpha and Binance.US, many in the TOSHI community anticipate a potential full listing on Binance’s main exchange, a development that could further accelerate price discovery and market participation.
Over the past seven days, the total amount of TOSHI held on centralized exchanges has also fallen by 2.4%.
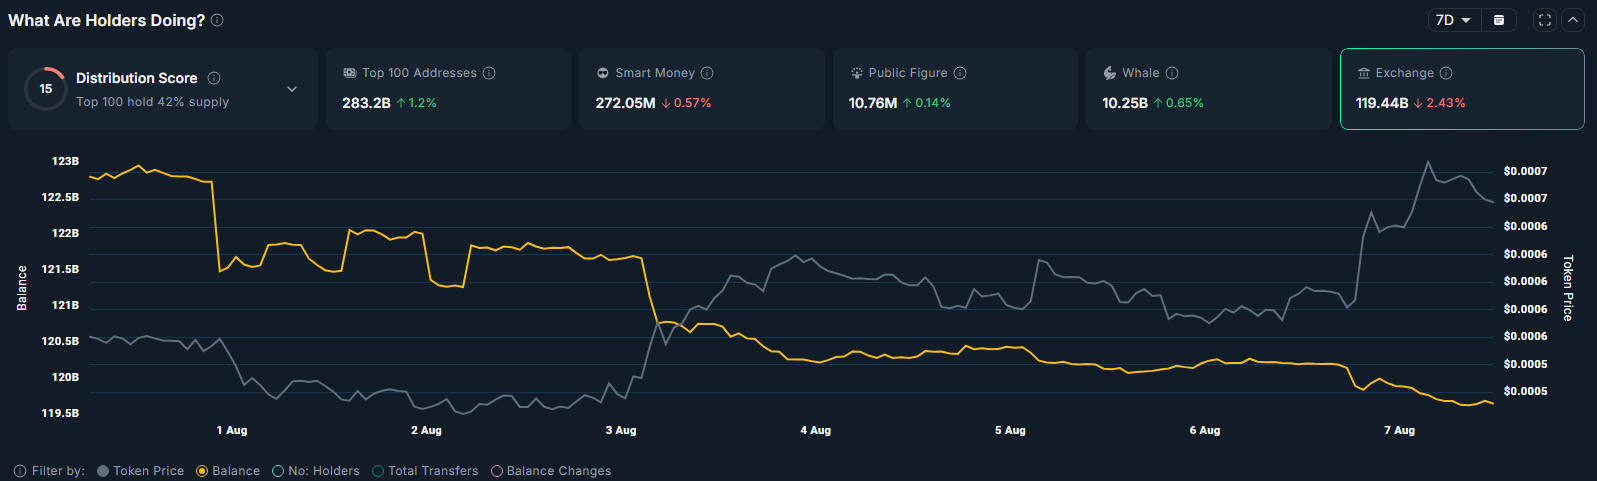
Such a reduction in exchange balances often signals a bullish undercurrent, as it suggests holders are increasingly moving tokens into cold storage or DeFi protocols rather than preparing to sell on exchanges.
TOSHI price analysis
On the technical front, TOSHI has been consolidating within a symmetrical triangle pattern since late January 2025.
The formation consists of a series of lower highs and higher lows, with the price action narrowing toward a point of convergence. Such patterns typically reflect a balance between buyers and sellers, with momentum building toward a decisive breakout.
Historically, a breakout from the upper boundary of a symmetrical triangle often results in a sharp upward move, as it signals that buyers have regained control.
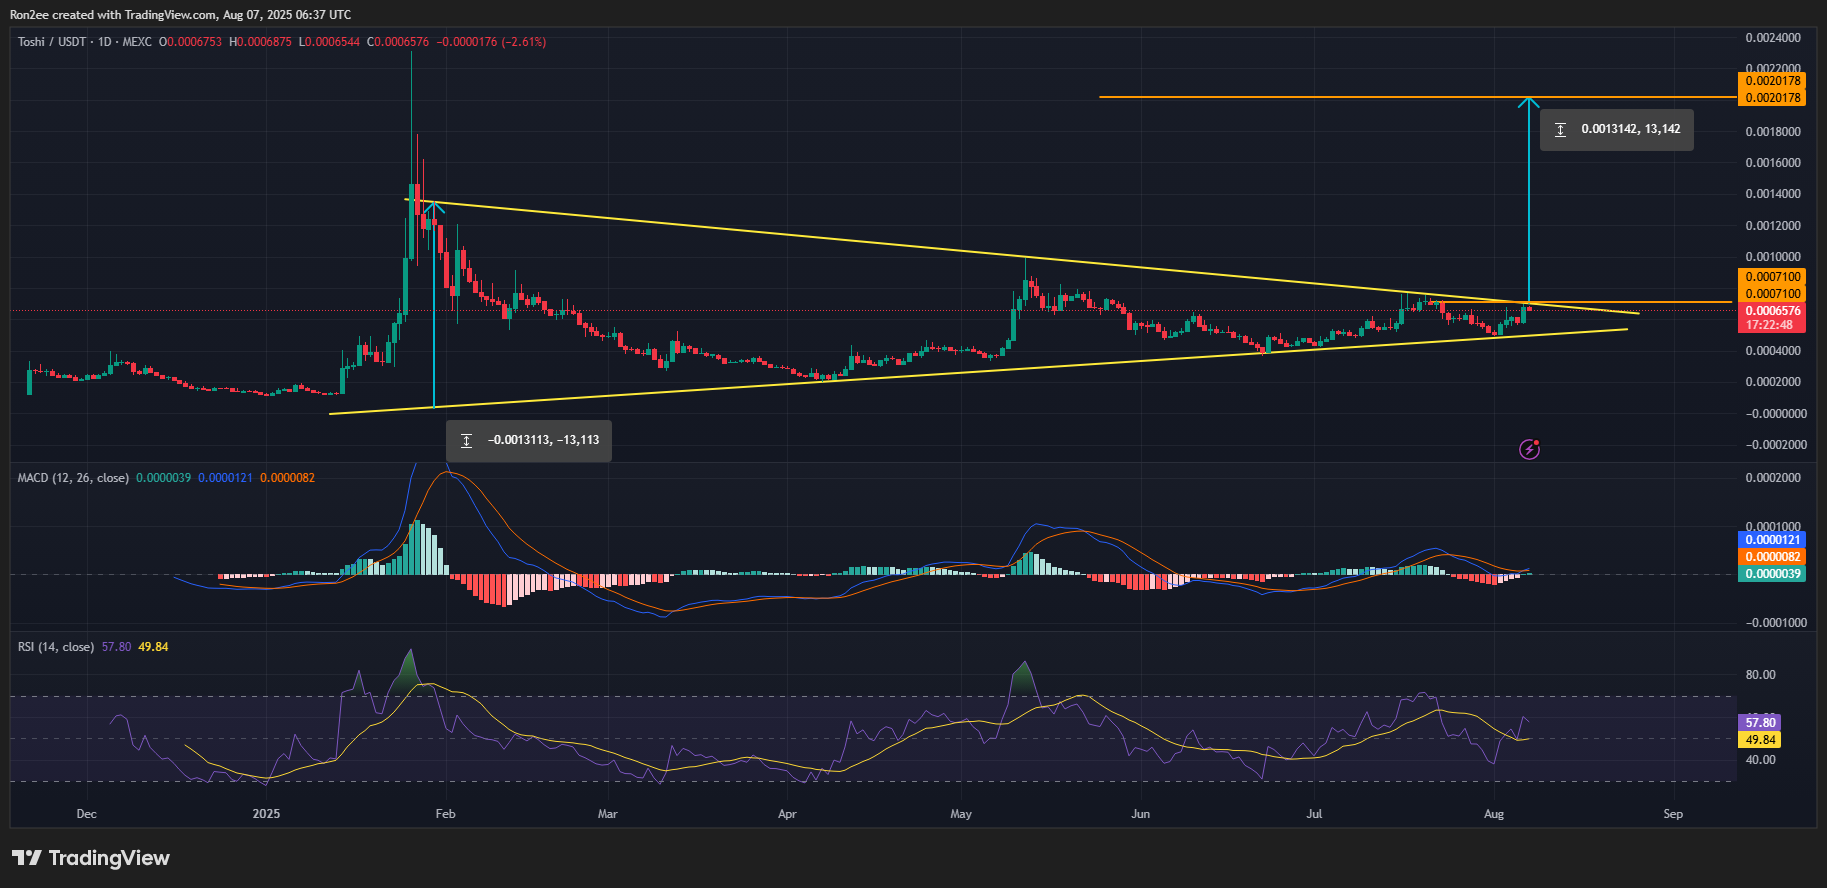
Currently, TOSHI is testing the upper boundary of this triangle at $0.00071. A confirmed breakout above this level would likely trigger further buying pressure and could mark the start of a sustained upward move.
Supporting this technical setup, momentum indicators have turned favorable. The MACD line has crossed above the signal line, suggesting a bullish shift in short-term trend strength. Meanwhile, the Relative Strength Index has climbed from 50 to 58, signaling increased buying pressure while still remaining below overbought levels.
Given this setup, a successful breakout from the symmetrical triangle would activate a measured move toward the next major resistance target at approximately $0.00201. The projected target, calculated based on the height of the triangle added to the breakout point, represents a potential gain of nearly 208% from the current level.
Worldcoin
WLD, the native token for Worldcoin, went live on Binance.US on Aug. 6. However, unlike TOSHI, WLD’s response was far more muted. The token rose just 4.2% over the past 24 hours to an intraday high of $0.971 on Aug. 7 before easing back to $0.96 at the time of writing.
Much of the excitement surrounding the listing may be overshadowed by increasing regulatory and privacy concerns related to Worldcoin’s biometric data collection methods. The project has already triggered scrutiny and stops in regions like Spain, Portugal, Hong Kong, Kenya, and Indonesia over potential violations of GDPR and inadequately informed consent practices.
More recently, China’s Ministry of State Security issued a formal warning about the national security risks of foreign crypto projects offering tokens in exchange for iris scans. Although unnamed, the description aligns closely with Worldcoin’s model of using its “Orb” device to scan irises for digital IDs.
The rally also lost steam as Worlcoin (WLD) balance held by whale wallets has dropped 27.4% over the past 30 days. This sharp reduction may reflect a wave of profit-taking or a broader risk-off sentiment among early investors. Such visible exits by whales often influence retail sentiment, as smaller investors tend to track large wallets for cues on market direction.
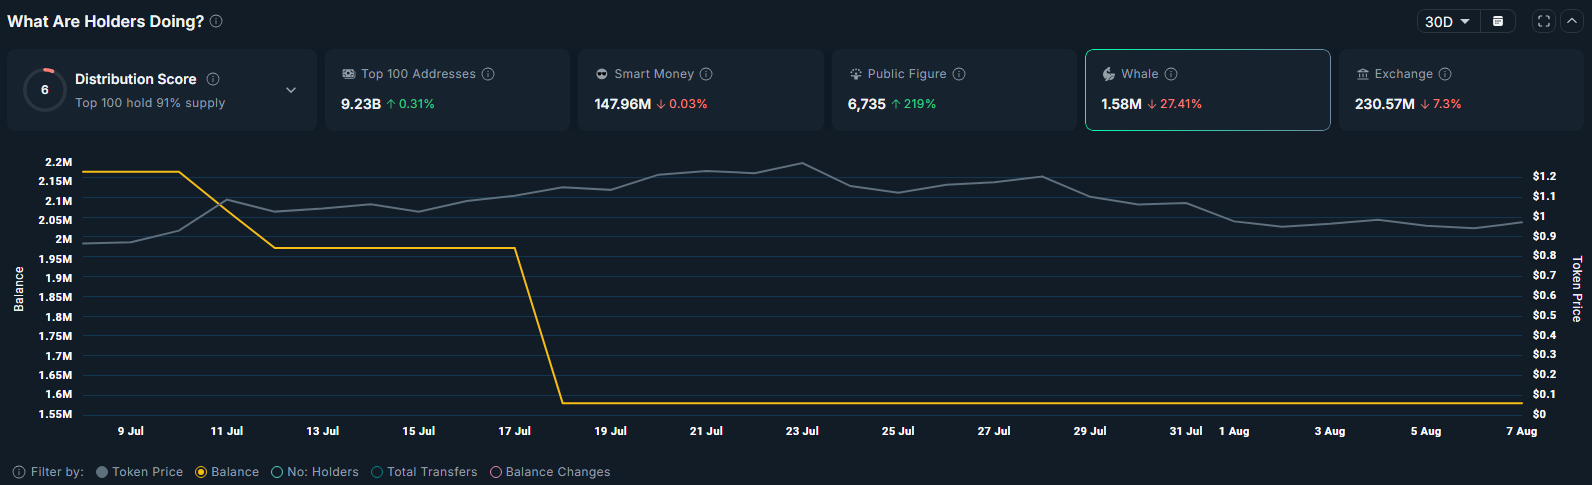
Taken together, the regulatory headwinds and signs of large-holder distribution may explain WLD’s lackluster price reaction.
WLD price analysis
On the daily chart, WLD appears poised to retest a key trendline that has served as dynamic support since April. This level has repeatedly absorbed downward pressure, making it a critical threshold to watch in the current session.
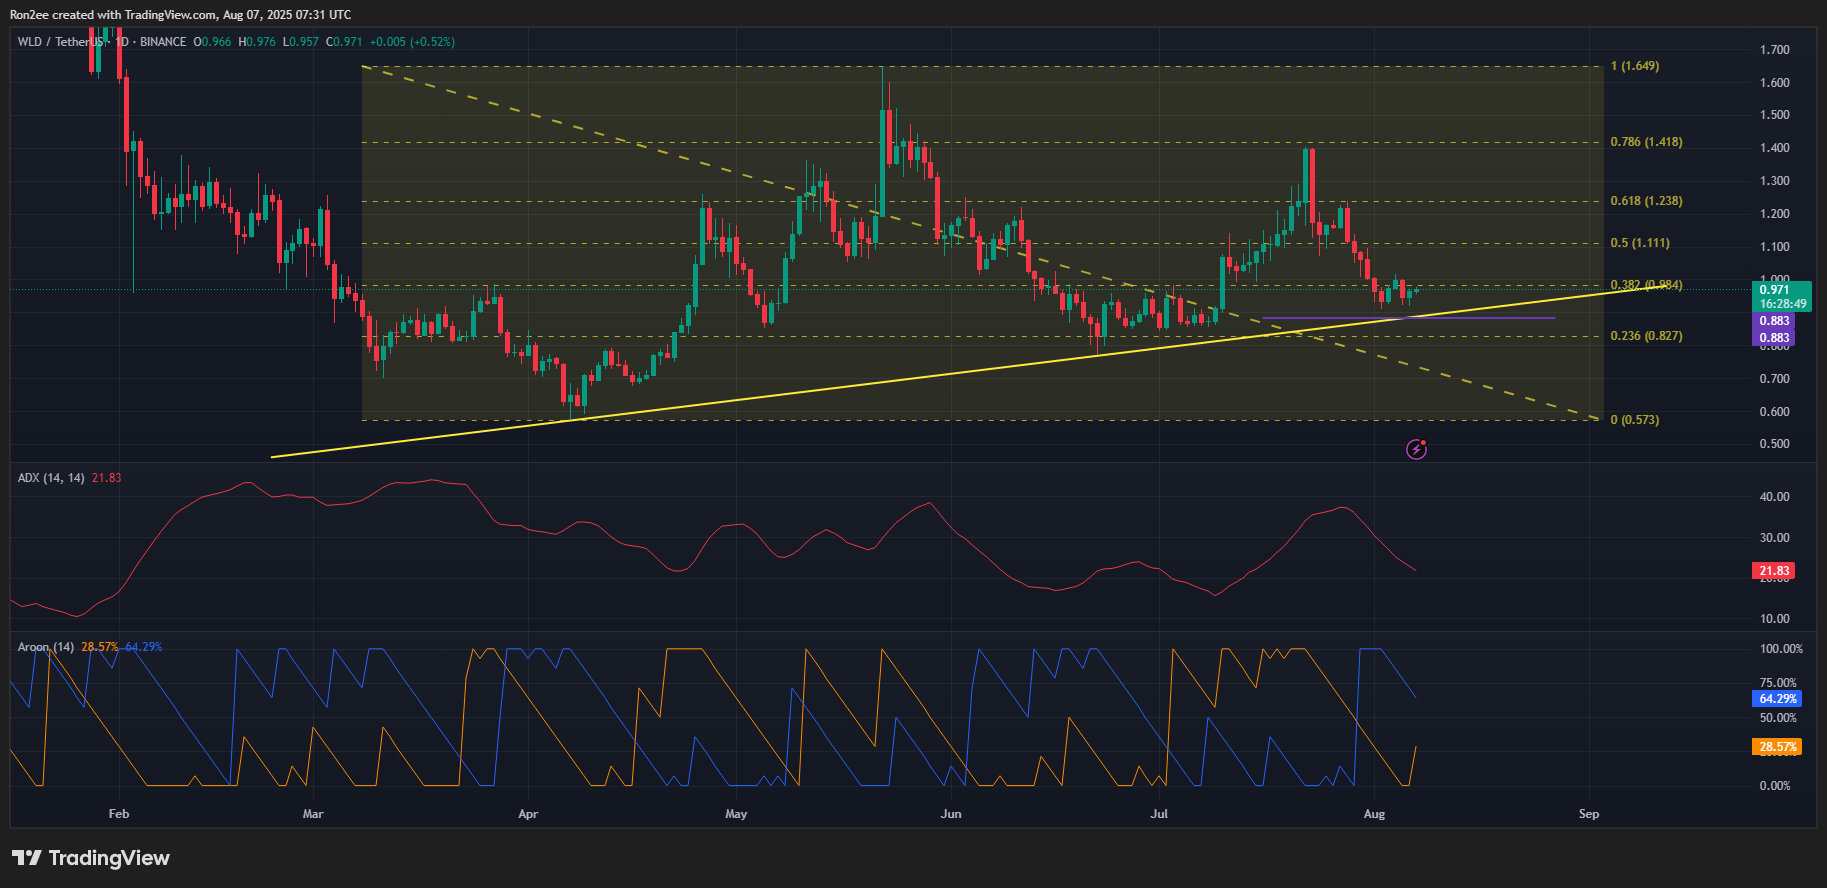
The Average Directional Index reading has now dropped to 21.86. Since an ADX value below 25 typically indicates a weak or non-trending market, this reading suggests that WLD is currently lacking strong directional momentum. This environment increases the likelihood of false breakouts and reinforces the importance of key support and resistance levels.
Additionally, the Aroon indicator also supports a bearish outlook. The Aroon Down is at 64.29%, while the Aroon Up is lower at 28.57%, suggesting that lows are happening more often than highs. This pattern usually points to increasing downward pressure on the price.
From a price structure perspective, if WLD breaks below the $0.883 support level, it could trigger a deeper correction toward $0.773, a zone last tested during its June pullback. This would mark a full retracement of its most recent short-term rally.
Conversely, if WLD rebounds above $0.984 by the close of today’s session, bullish momentum could return. In that case, the next logical upside target lies at $1.10, which coincides with the 50% Fibonacci retracement level from the recent swing high to low. A close above that level would strengthen the short-term bullish case and may shift sentiment more decisively in favor of buyers.
Disclosure: This article does not represent investment advice. The content and materials featured on this page are for educational purposes only.