
Strategist Sees Bitcoin Path to $170K Despite Selloff, Says ‘Buy the Fear’
Key Takeaways
- Thorne targeted $117,000 by mid-2027 before a possible record high.
- Bitcoin must reclaim $73,000, then clear $87,000 in his scenario.
- A decline below $57,000 would invalidate the strategist’s outlook.
Thorne Outlines a Route to New Bitcoin Highs
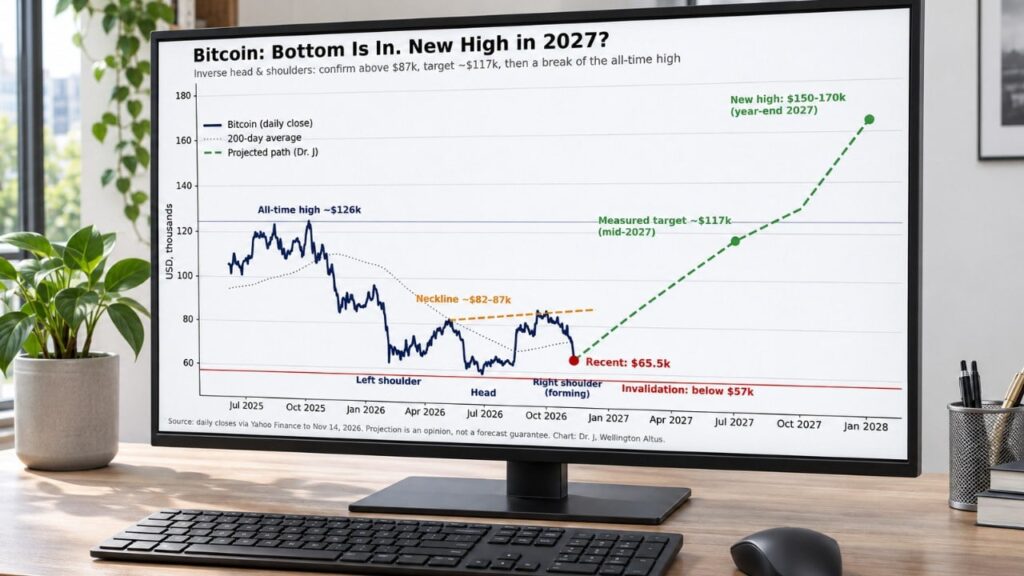
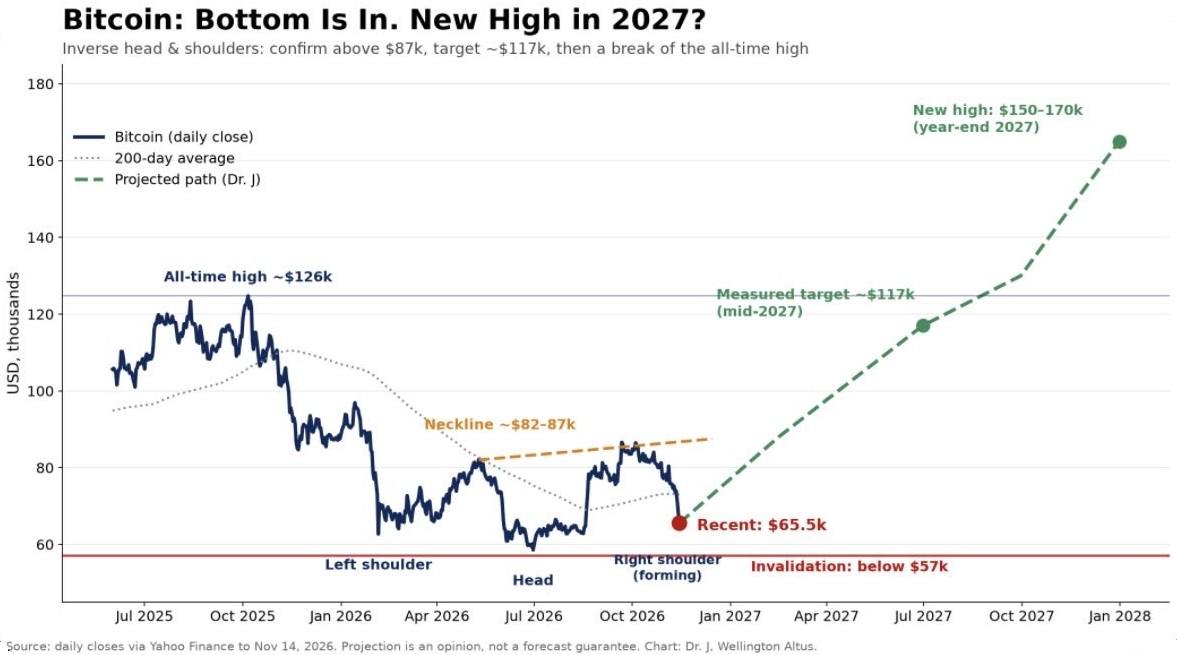
James Thorne, chief market strategist at Canadian wealth management firm Wellington-Altus, outlined on Nov. 14 a potential bitcoin recovery toward $150,000-$170,000 by the end of 2027. He questioned whether the selloff had established a bottom and whether a new record could follow next year. His case combined a developing chart pattern with his assessment that leverage drove the decline.
In his bitcoin forecast shared on X, Thorne set out the sequence of price levels needed for that recovery. He stated:
“Reclaim $73k. Confirm above $87k. Target $117k by mid-2027, then a break of the $126k high and $150–170k by year-end. That’s what the chart says.”
The inverse head-and-shoulders formation he described consists of three successive lows, with the middle one deepest, and can signal a reversal of a downtrend. He placed the left shoulder, or first low, near $59,000 and the head, or central low, around $57,000. The right shoulder, a third low above the head, was still forming in his assessment.
The $87,000 Threshold Behind the Forecast
A neckline connects the rebound highs between those lows, marking resistance where selling previously stalled price advances. Thorne’s chart placed that zone around $82,000-$87,000, with confirmation requiring bitcoin to rise above its upper boundary. Fidelity’s explanation of inverse head-and-shoulders formations identifies an upward neckline breakout as the pattern’s completion.
Subsequent trading pushed bitcoin below $62,000 on Nov. 15, with Coinglass recording a low of $61,956.30. That moved the price closer to Thorne’s $57,000 invalidation level while leaving it below his initial $73,000 recovery threshold. He stated: “Below $57k, I’m wrong.”
Such targets draw on historical prices and chart structure. Technical and fundamental analysis examine different evidence, with fundamentals encompassing economic conditions and adoption. A completed price pattern would support the technical interpretation; evidence about demand and liquidity would bear on the broader market assessment.
Liquidation Losses Accompany Pressure on Demand
Coinglass figures published on Nov. 13 showed crypto liquidations totaling $1.62 billion over 24 hours, including $1.46 billion in bullish positions. Those losses documented substantial forced closures during the decline. Thorne offered his interpretation:
“This washout was leverage, not fundamentals. Buy the fear.”
Glassnode’s Nov. 11 assessment nevertheless identified shrinking liquidity and weaker U.S. demand. Its findings included a $14.2 billion contraction in stablecoin supply over 30 days and $1.6 billion in net withdrawals from U.S. spot bitcoin ETFs across 20 trading sessions. Bitcoin also traded at a discount on Coinbase, reinforcing the firm’s assessment of weak U.S. buying interest alongside the derivatives unwind.
By Nov. 14, reduced leverage and renewed whale accumulation offered potential recovery signals amid those pressures. Whale accumulation refers to rising balances in wallets holding large amounts of bitcoin. Glassnode identified accumulation among wallets holding 100 to 10,000 BTC. Smaller holders and certain larger cohorts continued reducing their balances.